The cutback method is often used for measuring the total attenuation of an optical fiber. The cutback method involves comparing the optical power transmitted through a long piece of fiber to the power transmitted through a very short piece of the fiber. The cutback method requires that a test fiber of known length L be cut back to a length of approximate 2 m. It requires access to both ends of the fiber. The cutback method begins by measuring the output power Py of the test fiber of known length L. Without disturbing the input conditions, the test fiber is cut back to a length of approximate 2 m. The output power Px of the short test fiber is then measured and the fiber attenuation A and the attenuation coefficient a are calculated.
Different launch conditions can lead to different results. For multimode fiber, the distribution of power among the modes of the fiber must be controlled. This is accomplished by controlling the launch spot size, i.e. the area of the fiber face illuminated by the light beam, and the angular distribution of the light beam.
When the launch spot size is smaller than the area of the fiber face and the numerical aperture NA of the input radiation is smaller than the NA of the fiber, the fiber is said to be underfilled. Most of the optical power is concentrated in the center of the fiber and mainly low-order modes are excited.
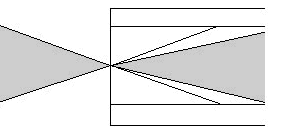
underfilled launch conditions
When the launch spot size is larger than the area of the fiber face and the numerical aperture NA of the input radiation is larger than the NA of the fiber, the fiber is said to be overfilled. Light that falls outside the fiber core and light incident at angles greater than the angle of acceptance of the fiber core is lost. Overfilling the fiber excites both low-order and high-order modes.
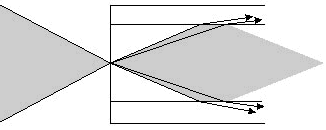
overfilled launch conditions
Launch conditions affect the results of multimode fiber
attenuation measurements. If too much
power is launched into high-order modes, the high-order-mode power loss will
dominate the attenuation results. Generally, fiber attenuation
measurements are performed using underfilled launch conditions.
The test fiber is loosely supported in a single-turn
with a constant radius of 140 mm. The transmitted signal power Ps(λ)
is recorded while scanning the wavelength in increments of 10 nm
or less over the expected cutoff wavelength. The launch and detection conditions are not changed while scanning
over the range of wavelengths. For the reference power measurement the launch and detection conditions are not
changed, but the fiber
is bent to a radius of 30 mm or less to suppress the second-order mode at
all the scanned wavelengths. The
transmitted signal power Pr(λ) is
recorded while scanning over the same wavelength range as before.
The attenuation at each wavelength is calculated.
Ps(λ) = 10-As(λ)/10, Pr(λ)
= 10-Ar(λ)/10,
Ps(λ)/Pr(λ)
= 10-(As(λ)-Ar(λ))/10
= 10Ad(λ)/10.
The attenuation Ad at each wavelength is calculated. Ad(λ)(dB)
= 10 log10 (Ps(λ)/Pr(λ)).
The longest wavelength at which Ad(λ)/km is equal to 0.1 dB is
the fiber cutoff wavelength.
H(f) = 10 log10(Pout(f)/Pin(f)),
or, if the launch conditions for the two experiments are not exactly the same,
H(f) = 10 log10(Pout(f)Pin(0)/Pin(f)Pout(0)).
The fiber bandwidth is defined as the frequency at which the
magnitude of the fiber frequency response has decreased to one-half its
zero-frequency value and H(f) = -3. This frequency is called the -3 decibel (dB) optical power frequency (f3dB)
and referred to as the fiber bandwidth. Bandwidth is normally given in units of megahertz-kilometers (MHz-km). Converting to a unit length assists in the
analysis and comparison of optical fiber performance.